Interim Housing Cost Benefit Analysis
Executive Summary
Early analysis based on rough population and cost assumptions shows that significant savings are possible if a sufficient number of ‘super users’ are diverted into interim housing with wraparound services and incur reduced healthcare and justice costs as a result. A predictive model could identify potential ‘super users’, who could then be diverted into interim housing quickly and compared longitudinally to a control group for more precise cost savings and outcome evaluations.
While California’s highest oversight body on homelessness, the California Inter-agency Council on Homelessness (CA ICH), recognizes that housing affordability is a significant driver of homelessness, its Homelessness Data Integration System (HDIS) has yet to present a clear, holistic view of homelessness at the state level. While HUD’s national Point in Time Count (PIT) is valuable to compare different Continuums of Care (CoCs) consistently, it could benefit from statistical correction and ultimate integration into the U.S. Census.
Local data collection at the city/county/Continuum of Care (CoC) level has been designed more intentionally to create learning feedback loops; however, better data collection, broader data lakes and predictive modeling based on these larger, more comprehensive datasets from all public agencies at every level could make the HDIS a powerful tool to defer preventable hospitalization and incarceration.
Cost Pressures Drive Homelessness
The Government Accountability Office (GAO) used Census and HUD Point in Time Count (PIT) data to model a significant correlation between median rent prices and homelessness, and both have risen steeply between 2015 and 2023. While wages have also risen, they have not kept pace with rents nor inflation, as over the same time period, the median gross rent as a percentage of household income, or ‘rent burden’, was close to or over the threshold for ‘cost burdened,’ each year, meaning that more than 1/3 of the household’s income goes to housing. More concerning, since the median is so close to the cost burdened threshold, 50% of renter households likely spend close to or more than 1/3 of their income on rent, meaning that the population at risk of losing housing because of affordability is large. Eviction and Poverty in American Cities, a 2023 paper published by the Census Bureau’s Center for Economic Studies (CES), found in Cook County and New York City that “an eviction order increases homelessness and hospital visits and reduces earnings, durable goods consumption, and access to credit in the first two years.” However, data on eviction rates in CA wasn’t readily available. Median rents and rent burdens for CA, San Francisco and Sacramento are from the U.S. Census 1 year American Community Survey (ACS) API.
GAO also found that PIT data “likely underestimate” the homeless population. In fact, a PPIC analyses on health costs estimated the actual homeless population in CA could be as large as 300-450,000 based on those who receive care at hospitals and from other ‘homeless assistance programs.’ CAL ICH’s 2021 report to the Legislature counted 331,825 unique people who received services over FY 2020-21, out of 571,246 total between 2018 and 2021, an annual average of about 190,415, meaning that as many as 141,410 (43%) were homeless more than a year. Initial CA PIT results for 2023 indicate unsheltered homelessness increased 10%, sheltered homelessness increased 5%, and the overall population increased 8.6% year over year. These growth rates were annualized for the remaining 3 months in 2023 for purposes of estimation, and the actual figures may vary. Due to the pandemic, the 2021 count focused on sheltered people, so we used an average of the following and preceding years for smoothing. While the pandemic also affected the quality of the 2020 Census, it’s not clear if there are significant implications for this analysis.
As a general correction, unsheltered counts were scaled by 2.5 to create a mid-range estimate of the total number of people who experienced homelessness during the year, according to PPIC’s guidance to scale by “a factor of 2 for the lower-bound estimate and 3 for the upper bound, as this is the consensus estimate from housing and policy researchers.” Sheltered counts were adjusted based on the average number of days spent in shelters, per HUD’s System Performance Metrics (SPM) data collected from CoC HMIS from 2015-2022. In San Francisco, for example, this 7 year average is about 306 days, so the sheltered counts were scaled by 1.16 to account for individual turnover throughout the year. Sacramento’s 7 year average is 143, lower than the statewide average of 153 days, and both are below the national average of 165. While we could have corrected the sheltered population statewide by as much of a factor of 2, this would have pushed overall estimates out of the midrange consensus, so we corrected by a factor of 1.6 as a compromise.
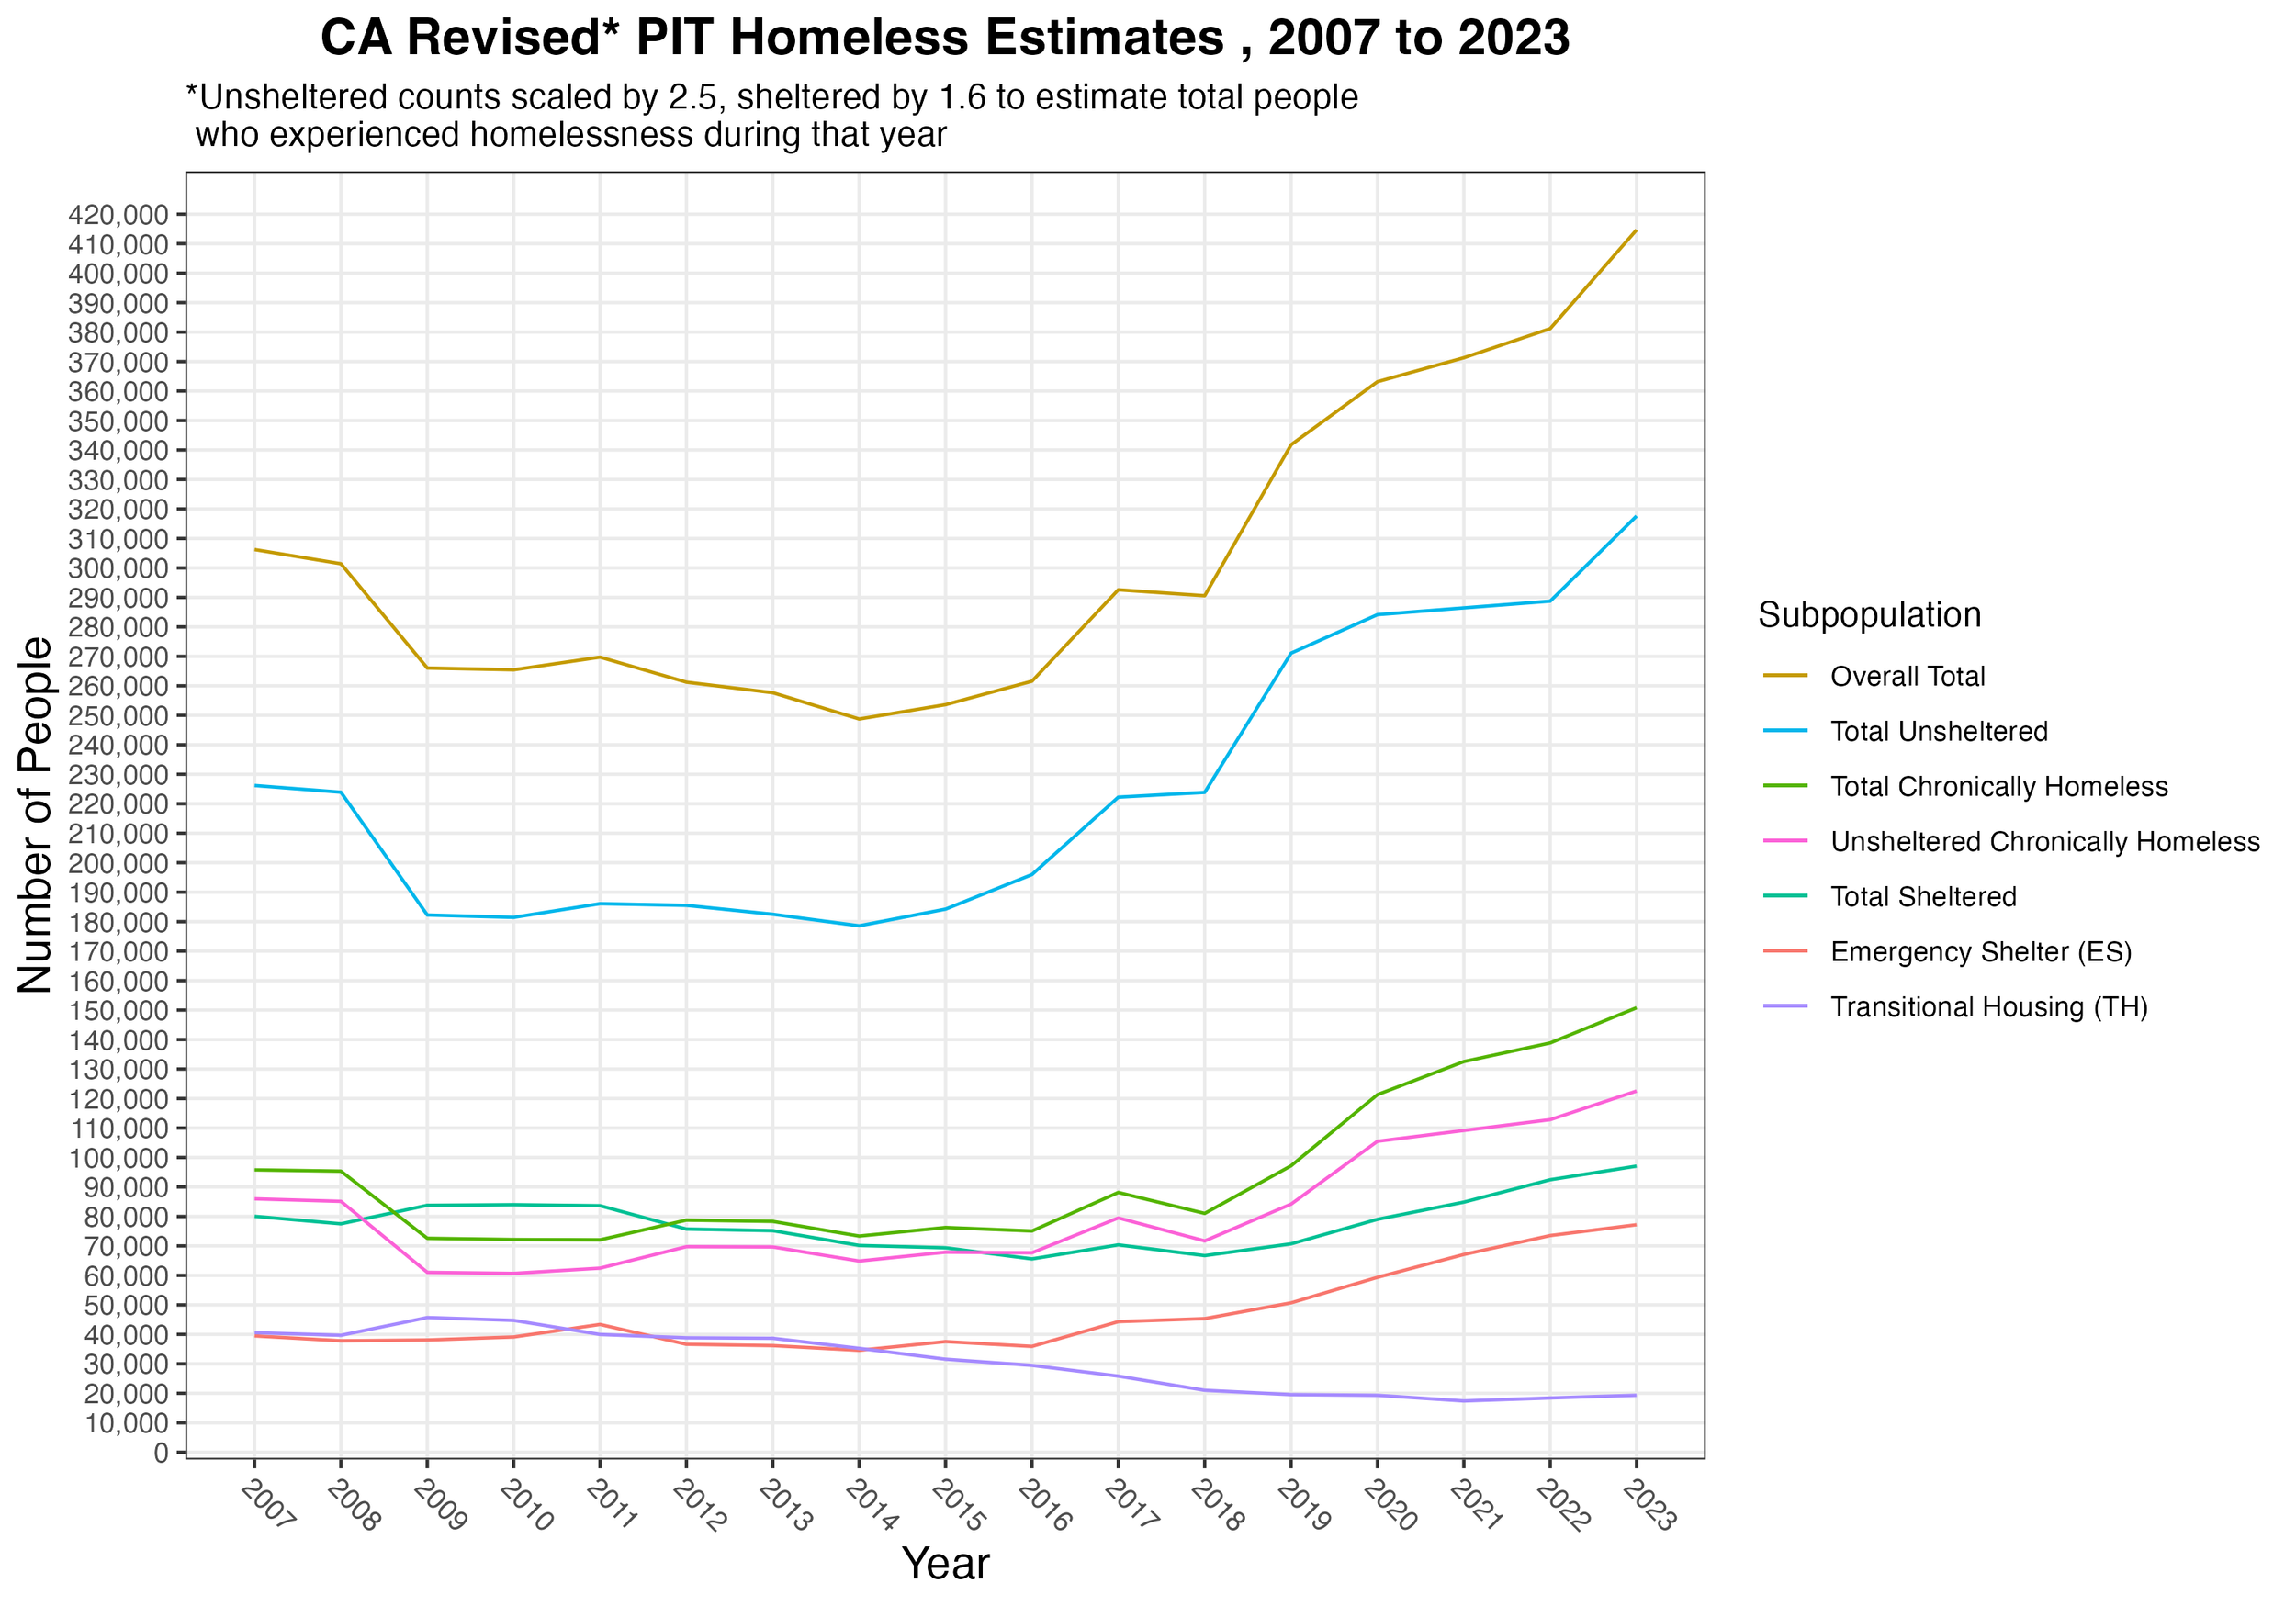


While the emergency shelter population rose, it only captured a portion of overall growth. Notably, transitional housing declined in association with a sharply rising unsheltered population. A third type of shelter, SH, only applied to 317 people in 2022, the most of any year, so it was excluded. While we also retrieved age group data from data.ca.gov, no age group appeared to grow more rapidly, though there are reports to the contrary. Despite CA ICH reporting increased bed capacity to .82 beds per 1000 residents from 2018 to 2021, the highest rate in the country, as well as slight increases in permitted new housing units, NAEH analyzed HUD data to find only 29% capacity for homeless individuals, which has created long wait times for almost any shelter.
This contributes to rising chronic homelessness, those who have been homeless more than 1 year, the most concerning trend. Once homeless, many will develop additional health problems, both physical and psychological, and these issues will intensify over time. As these problems become more acute, they become more difficult to treat, and healthcare costs increase drastically due to a relatively small subpopulation of ‘super users’, the top quantile who account for the majority of costs due to frequent hospitalization and interaction with the justice system. We assumed that super users are 15% of the total population, and that 20% of the total population interacts with the justice system. While these two populations overlap, it’s not clear to what extent, though younger people likely interact more frequently with the justice system while older people interact more frequently with the healthcare system. ‘Super users’ may be chronic, meaning they incur costs frequently over a longer time period, or they could be episodic, meaning that they incur significant costs due to a singular catastrophic event.
Governor Gavin Newsom’s administration has estimated that 7-12,000 individuals in CA will qualify for Community Assistance, Recovery and Empowerment (CARE) Court, and it is likely this population, already deeply embedded in public health and social service networks, has significant overlap with super users. As the following section shows, a modest increase in super users significantly increases cost, and targeted investments to reduce the super user population, along with the entire homeless population, can be cost effective.
Cost Analysis
Federal, State, County and City funds mingle and overlap across a large, fragmented network that Cal ICH estimated spent about $10 billion on services from 2018 to 2021, a figure the Legislative Analyst’s Office (LAO) estimated at $20.6 billion. Currently it is not possible to account for much of this spending, and the California State Auditor has called for greater transparency and meaningful outcome evaluation. The Auditor’s 2020 report on the state’s efforts to make housing more affordable suggest that the cost pressures at the top of the homeless population ‘funnel’ are unlikely to abate over the near- nor mid- term, and its 2021 report on 5 Continuums of Care (CoCs) warned that local implementation of these funds was opaque and emphasized increasing coordination among public agencies at all levels as an immediate priority. Further, the Auditor’s forthcoming report on homelessness spending will likely illustrate similar gaps between funded programs and outcomes, which supports an assumption over the next five years that CA’s homeless population will continue to grow without more intentionally designed and better targeted investments.
CA policy Lab’s 2019 Predicting and Preventing Homeless in Los Angeles emphasized that prevention is possible and can be cost-effective, more so when it is targeted to the highest risk individuals. As an example, they cited New York City’s Homebase prevention program, and that team has already developed predictive models to improve service targeting and delivery for high risk people in LA. CA Policy Lab also noted that many people at risk of homeless will experience a relatively rapid surge of need for public health and social services immediately preceding becoming homeless, possibly similar to the sudden usage spikes that characterize some super users. While prevention is likely the most cost-effective option for permanently reducing homelessness, in the meantime using a predictive model to identify those currently homeless who are at high risk of becoming ‘super users’ and targeting an intervention like interim housing to prevent this could help address the current large unsheltered homeless population and flatten future growth.

Using California’s Department of Health Care Access and Information’s (HCAI) 2019-2020 data on emergency department and inpatient hospitalization encounters with homeless individuals, we assumed the average cost of an inpatient hospital stay in California in 2023 was $18,815, and the average cost of an emergency room visit in California in 2020 was $2,960. These were hastily collected data points from private data brokers Hospital Pricing Specialists and ValuePenguin, and better data may be available. After summarizing the number of encounters by payer, we multiplied by the average cost to calculate total costs of emergency room visits and inpatient hospitalizations by payer. The public costs are assumed to be the sum of those not covered by insurance and those paid by Medi-Cal or Medicare.
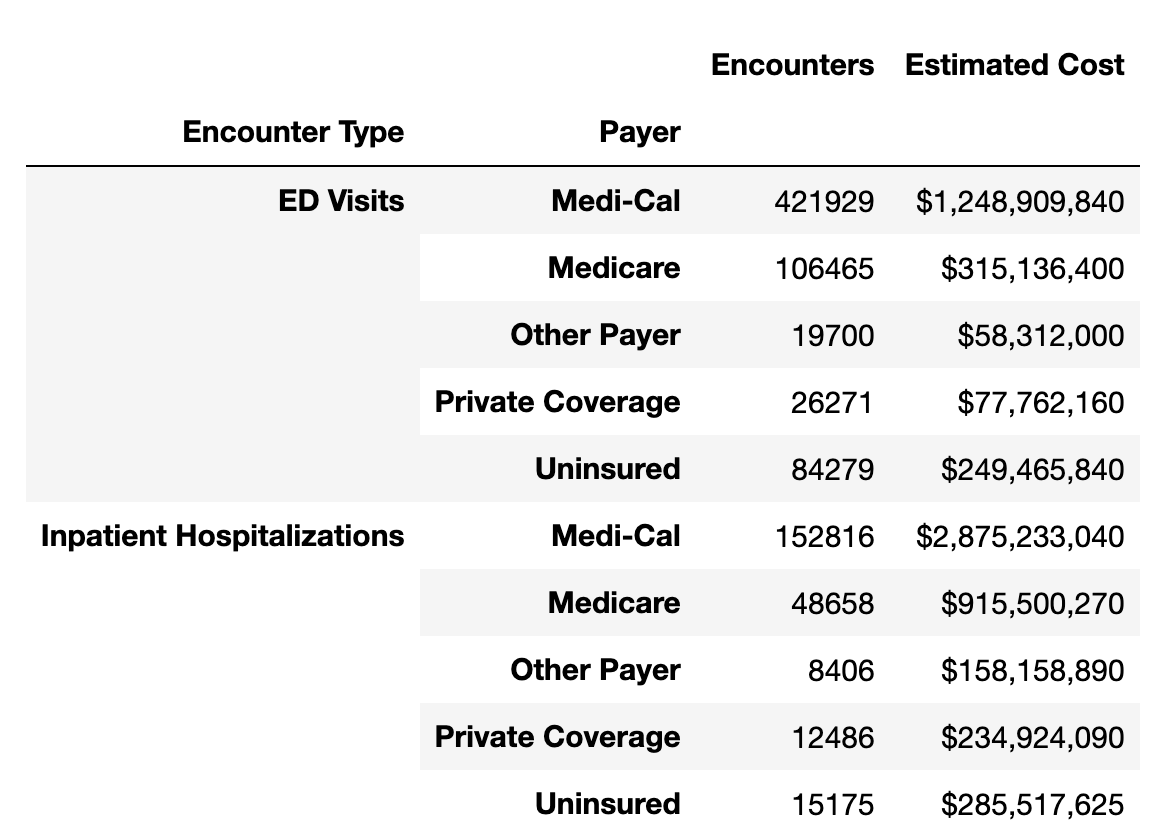
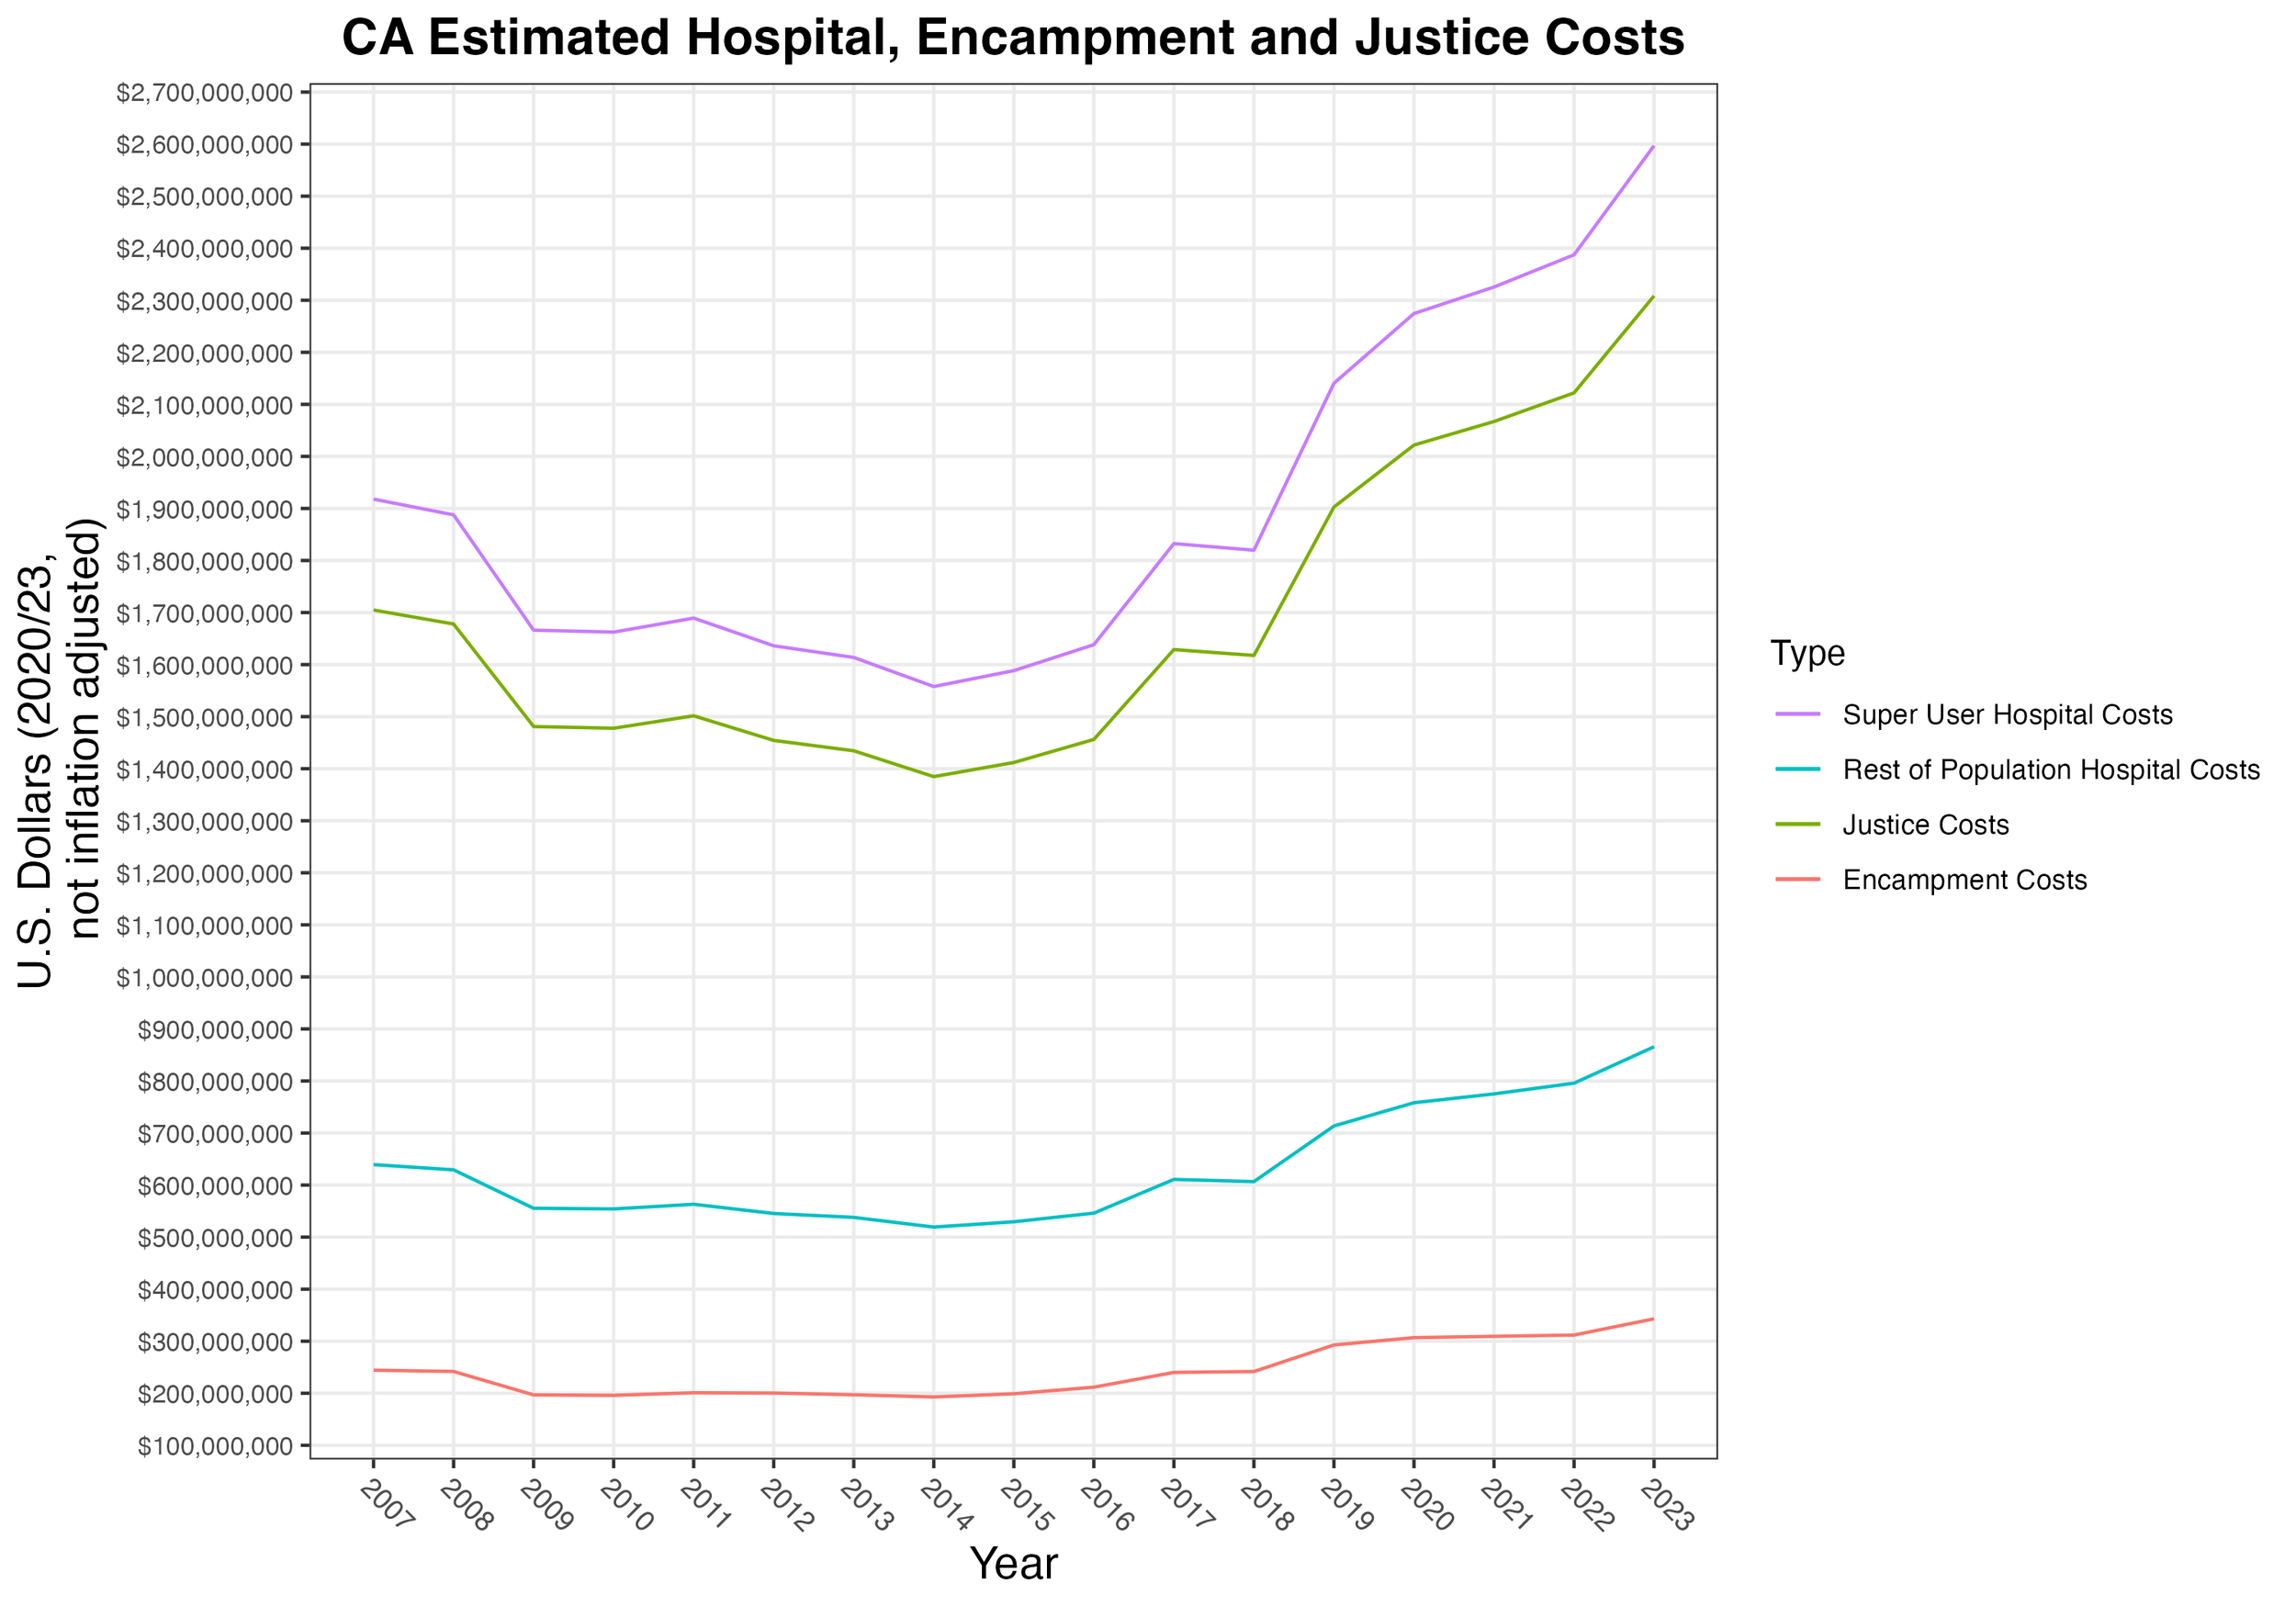
If we assume that California’s super user population is the top 15% of the total population who account for 75% of total costs (the ‘head’ of the ‘long tail’ distribution), in 2020 54,474 super users incurred 75% of just over $3.08 billion, about $42,475 each, while the remaining 308,690 non super users incurred about $2499 each. We used averages of these per capita costs between 2019 and 2020, $41,753 and $2456, to estimate all other years, and actual data will vary. We also assume $1080 per unsheltered person in encampment costs based on HUD’s 2020 San Jose Encampment report, which tallied $8,556,591 for 7922 unsheltered in San Jose in 2019, mostly in labor to provide “outreach and engagement services, encampment cleanup, clearance, and closure; encampment prevention; and coordination and management of the encampment response—much of that the time of the San Jose Police Department’s Street Crimes Unit, operation of the Homeless Concerns Hotline, provision of health care to encampment residents, and other encampment support activities, such as sorting and storing residents’ personal belongings.” We further assumed that the costs to the justice system would be 33% of the total costs in proportion to healthcare being 50%, resulting in an average annual per capita cost of $30,376 if 20% of the total homeless population incurred justice costs.


RIPL’s 2020 paper on predicting super users to capture ‘Divertible MediCare Costs’ cited a 2015 study in Colorado that found that about 6% of the population studied continuously met super user criteria over the 2 year period, and that interventions typically occurred only after significant costs had already been incurred. Destination Home SV’s 2015 Home not found report estimated that Santa Clara county incurred $520 million costs over 2012 for services rendered to 104,206 individuals, roughly $4990 per person, and that these expenses comprised 53% healthcare, 13% social services and 34% justice services. The super user population was the top decile - the 10% of the population that consumed 61% of all costs: $300 million. The top 5% alone accounted for 47% of the total: $230 million. While the average annual cost per homeless person was $5,148, those in the top 5% averaged more than $100,000. Destination Home SV reported that the 103 homeless residents in the tenth cost decile who were housed through the Housing 1000 program incurred $62,473 on average annually in public costs before being placed into interim housing with services compared to $19,767 after, a $42,706 (68%) reduction.
While this analysis assumed that the costs to the justice system would be 33% of the total, as observed in San Jose, this figure also likely varies considerably from CoC to CoC. For example:
the City of Oakland’s audit of spending on services for homelessness residents counted $69 million spent, mostly through contracted third party organizations, on 8683 individuals over three years, about $7947 per person. 46% of this funding was federal, 35% state, 17% city and 2% county. 4110 out of 6697 ‘exited’ the city’s crisis response programs, while 729 out of 1986 exited ‘longer-term housing programs,’ yielding success rates of 72% and 37%, respectively.
Social Finance’s 2018 report on homelessness costs in Sacramento identified 250 ‘highest using persistently homeless’ individuals who averaged over $45,000 in city and county costs per year, up to over $100,000. They estimated that Permanent Supportive Housing cut $13,250, 30%, from shelter, healthcare and justice costs for an $11,000 intervention, a cost benefit (amount saved / amount spent) ratio of about $1.20. The authors characterize this estimate as conservative, since it does not include state funds, nor a comprehensive accounting of incarceration costs. While the study also suggests targeting the highest service users jointly between city and county, it is not clear that this has been implemented at all in the intervening 5 years.
A 2016 report commissioned by the Los Angeles County Chief Executive Office found that over FY 2014-15, $965 million in costs incurred by 148,815 single homeless adults comprised 60% healthcare, 10% law enforcement and 30% social services. On average, this is $6,481 per person, while the most costly 5% incurred $51,227 each per year and the most costly 20% incurred $21,358 each. The top 5% of these ‘high-volume service users’ accounted for about 40% of total county spending, $381.1 million, and the top 20% accounted for 66% of the total.
Kern County’s 2020 report found that its ‘housing first’ programs reduced hospitalization 88%, ambulance transports 65%, ER visits 49%, and incarceration by nearly 100%. In total, Kern County estimated that savings were about $23,318 annually per person. The report noted that most of the study population ‘had to wait months for housing’ and ‘preferred to remain unsheltered during this time’. Further, the county’s cost estimates were incomplete due to most public agencies not coding for homelessness when providing services, yet this did not affect its overall conclusion: “It is more cost-effective to house homeless people than to leave them on the streets or in shelters.”
More specific information on arrests and incarceration could better illustrate justice costs, and much of it likely already exists (perhaps a combination of County, CDCR, Sheriff, DOJ), although it is unclear if it is public or even collected and published systematically in any form. Currently, incarcerated people may not be counted as homeless, despite often cycling from one to the other. Community response services in urban areas (like MACRO in Oakland) may also be new sources of data as they increasingly engage with the homeless in lieu of the police.
Intervention Scenarios
It is difficult to determine how many impoverished or rent-burdened households produce homeless individuals statewide, and many of these individuals will contact multiple agencies and service providers, especially those related to healthcare and the justice system, whether via an emergency room visit, hospital stay, civil eviction, arrest, criminal conviction and/or incarceration. McKinsey’s Social Responsibility Initiative created models of homelessness in San Francisco and Los Angeles that could be generalized to represent homelessness in any city. A future model would benefit from including jails and prisons both in the at-risk population as well as a possible outcome for those currently homeless.

The large ‘at-risk’ population would benefit from simple, though expensive, cash transfers or other subsidies which are not likely given current political and fiscal trends, so we assume linear growth based on past trends, including our main predictor, median rent price. Under these assumptions, the model predicts roughly $300 million in additional super user hospital costs and $200 million in additional justice costs statewide by 2028.
San Francisco and Sacramento
While McKinsey’s ‘homelessness cycle’ model usefully illustrates the complex dynamics driving the growing population, it does not include some interventions, like interim housing, in its assumptions; rather, though chronic homelessness increased from 2650 to 4408 (66%), most of these, 1708, are assumed to be housed in permanent supportive housing. HUD CoC System Performance Measures Data, however, show that 561 exited to permanent housing in 2021, 555 in 2020, 504 in 2019 and 481 in 2018. This means that to realize McKinsey’s illustrated solution, exits to PSH would need to increase by a factor of 3. The city also reported adding 1590 new permanent supportive housing units for adults between FY 2020-21 and FY 2021-22, a 15% increase, at a two year operational cost of $12,067,542 and two year acquisition costs of $56,123,304, for a rough annual unit cost of $21,444. However, this includes ‘scattered’ PSH sites, which are subsidies for existing housing that lower per unit acquisition costs. It is also not clear if operating expenses includes wraparound services, as it is very low. Using $3795 per unit per year in operating costs and restricting acquisition costs to the 702 ‘site based’ units raises the rough annual unit cost to $43,769. Notably, San Francisco spent only 37% of the $389.9 million budgeted for permanent housing of all types, suggesting that new unit development is severely constrained by non-financial factors.
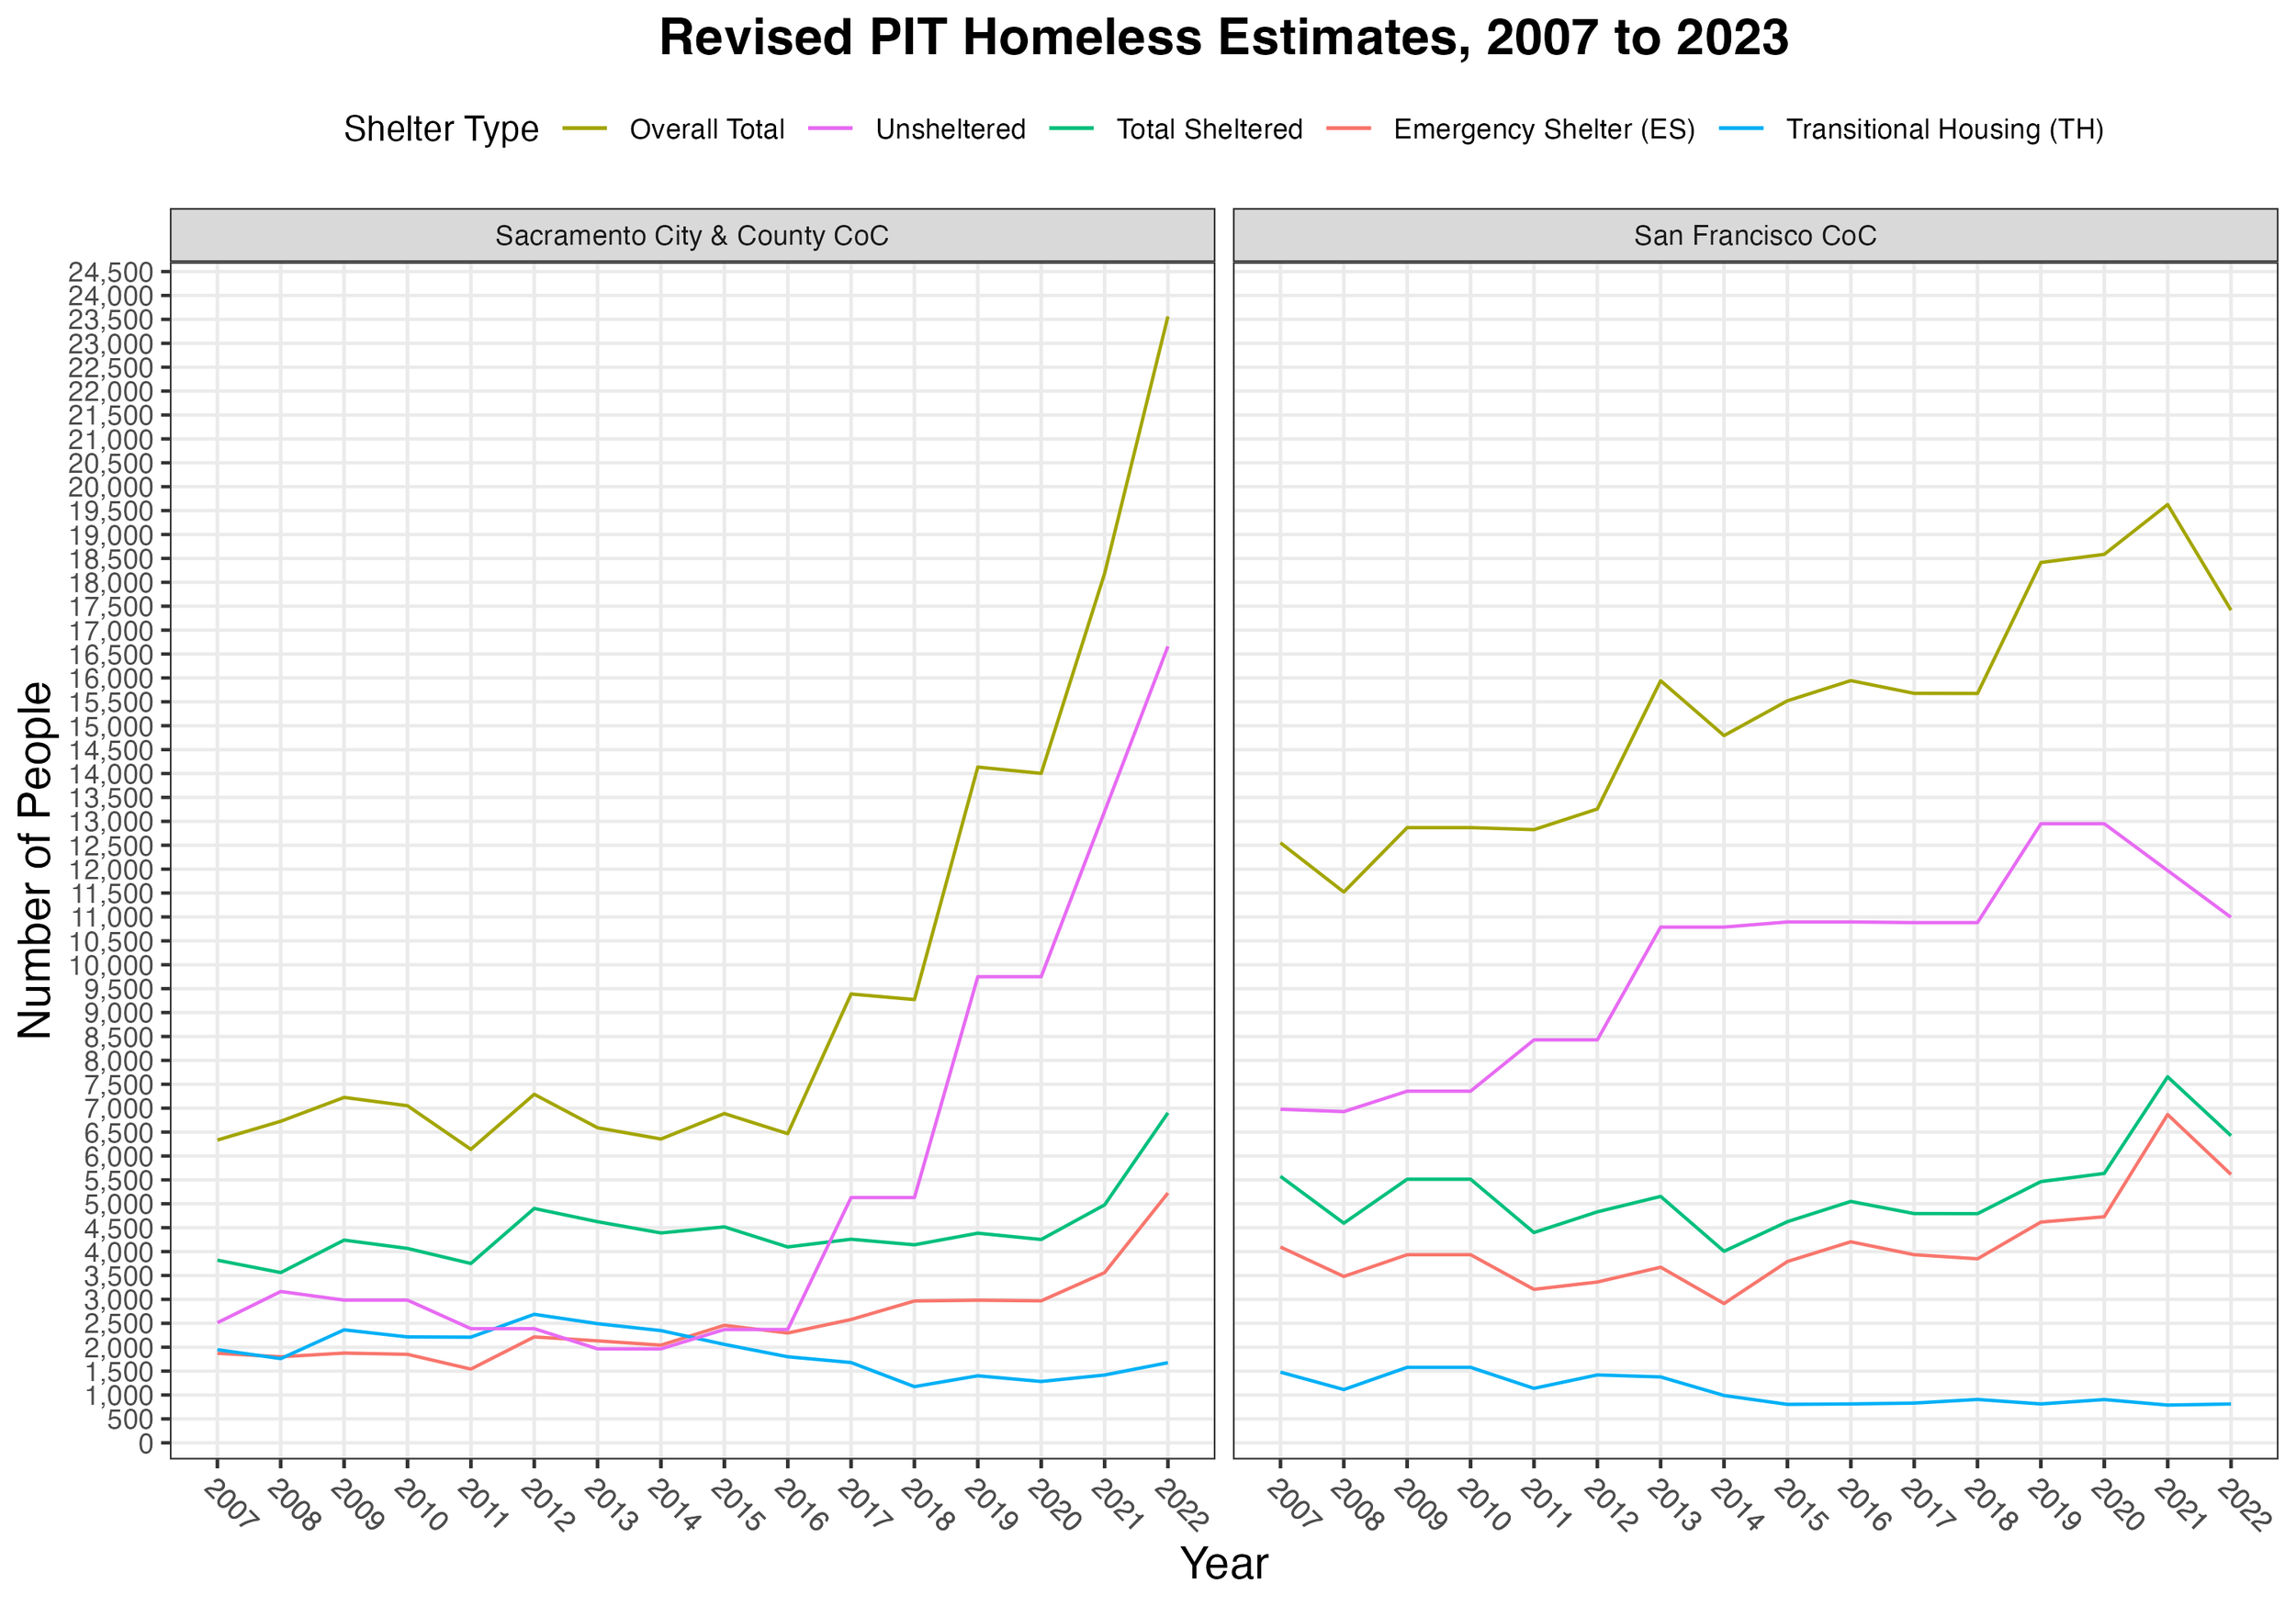
San Francisco defies state growth trends, as overall and unsheltered homelessness have recently decreased, though they remain historically high. It is possible that a sudden surge in new permanent supportive housing units and quick activation of the ‘scattered sites’ subsidy model coincided with more streamlined coordinated entry processes to fill more units more quickly. This is supported by modestly lower vacancy rates, although still closer to 10% than the 7% target. Further, while more detailed data isn’t publicly available, the SF Chronicle recently reported that people wait nearly a year, 330 days, to move into housing after they apply, and the city’s shelter wait-list, over 400 people long in November 2023, placed only 13 people in shelter beds in August, 2023.
If wait times remain high, the population continues to grow and new unit inventory does not keep pace, this could be a temporary dip. The sharp dip in permanent supportive housing and coinciding increase in ‘Other Permanent Housing’ warrants further investigation, as SF city and county have taken fuller advantage of vacant hotel/motel rooms since the pandemic that may not provide sufficient access to services. Facing significant public criticism, San Francisco has also more aggressively cleared encampments, especially for high profile events like APEC, and since January, 2023, its county jail population has begun to grow for the first time since the pandemic, it is likely a significant number of homeless individuals are now jailed. Given the high outward migration from the Bay Area to the Central Valley and Western Sierras during the pandemic, it’s also possible homeless and at-risk individuals migrated, and this could partially explain Sacramento County’s steep increase, about 249 percent between 2015 and 2022.

Given long wait times for shelter and housing, slow development pipelines for new units and high acquisition costs, meeting the current homeless population, much less any future growth, is unlikely with only permanent units. Investing now in a significant number of interim housing units with wraparound services will help flatten the homeless population’s growth, better target interventions and complement needed growth in permanent units while remaining cost effective. The intervention projections below assume that between $88.1 million and $104.5 million invested in new interim housing with wraparound services will create 2240 units, including $36-$40k per unit per year in Operational Expense for services and a one time Capital Expense between $50 and $100k amortized over 15 years. We assume that these units will serve 4480 people per year over 5 years to reach 22,000 total, achieve an initial successful exit rate between 80 and 85% and an annualized return rate between 7 and 10%, consistent with the average 24 month ‘return rates’ HUD SPM show for each CoC.

The savings:cost ratios below assume that in San Francisco, of the 22,000 reached over 5 years, 68%, 14,960, would have become unsheltered, and 15% of the total, 3300, would have become super users. Since the average ‘successful exit’ rate from ES, TH and RRH is 26% from 2015-22 while the same rate for PSH is 96%, we assume that the successful exit rate for interim housing will be closer to PSH. Given an 80% successful exit rate that results in 17,600 fewer total homeless (3520 per year), 11,968 fewer unsheltered (2394 per year) and 2640 total fewer super users (528 per year). Since the average 24 month return rate in SF from 2015-2022 per HUD SPMs is 14%, we also factor in 7% of the successful exit population ‘returning’ each year.
In Sacramento, we assume that of the 22,000 reached over 5 years, 58%, 12,760, would have become unsheltered, and 15% of the total, 3300, would have become super users. As Sacramento’s 7 year average success rate from ES,TH and RRH is 45% and the same rate for PSH is 97%, we assume an 85% success rate that results in 18,700 fewer total homeless (3740 per year), 10,846 fewer unsheltered (2169 per year) and 2805 total fewer super users (561 per year). Since the 24 month return rate in Sacramento from 2015-2022 HUD SPMs is 20%, we also factor in 10% of the population ‘returning’ each year.
In both CoCs, we assume that 70% of the successful exits self resolve, 20% are placed in permanent housing and 10% leave the population due to miscellaneous causes (death/migration/incarceration). The 15-20% ‘failure rate’ remains in the homeless population, while those that ‘exit’ through the intervention are added cumulatively each year and subtracted from the linear estimate. While this reasonably estimates costs deferred by the intervention, it does not effectively model overall population changes over time, which will be more dynamic. Lastly, we only assume a partial reduction of 75% of health costs and 80% of justice costs when the interim housing intervention is fully successful.
| CoC | Est SU Health Cost | Post Intervention | Est Just Cost | Post Intervention |
|---|---|---|---|---|
| San Fran. | $49,413 | $12,354 | $32,942 | $6588 |
| Sacramento | $56,046 | $14,012 | $39,135 | $7827 |

While the steep growth rate in Sacramento is only flattened by the intervention, the more static population in San Francisco declines steadily, highlighting again the importance of reducing the overall homeless population’s growth rate via prevention in order to optimize other interventions. While this analysis only produced rough estimates based on overgeneralized assumptions from the limited data available, these general trends indicate that any intervention that reduces the homeless population, especially the unsheltered and super user subpopulations, could be cost effective when compared to healthcare, justice and other costs already known to be significant in these populations. Effectively targeting individuals with the highest risk of high healthcare and/or justice costs and intervening before these costs occur will maximize cost effectiveness. Further, parallel investments to prevent new entrants to the homelessness cycle, whether through a statewide eviction moratorium, rent control, rent subsidies or others, will increase savings by enabling the population to shrink as rapidly as possibly. As a banking metaphor, consider eliminating a debt by paying off the principle versus merely keeping up with interest payments.
With more comprehensive data about the individuals who access these services and experience homelessness, policymakers could better evaluate how public funds can be used to address the alarming growth of homelessness and related health, sanitation and safety issues in California. While this analysis focused on financial costs and benefits, it is vital to recognize spending on incarceration, emergency services and healthcare also quantifies human suffering. Inasmuch as easing this suffering through targeted interventions is foundational to humane and ethical public policy, quantifying this impact financially allows policymakers to effectively gather and deploy resources. This analysis in no way seeks to establish any cost savings standard ahead of the humane and ethical imperative to provide shelter and care to all Californians.